![[O'Reilly Online Publishing Report]](opr.gif)
February 1, 1996
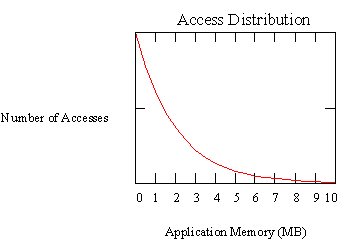
This document presents a mathematical model that we have derived for the technique of providing a system with a compressed pagefile ("swap file") cache. The fundamental concept that makes the model possible is viewing the code and data space of an application as a set of memory pages, each of which is accessed with varying frequency. Typically, applications exhibit roughly an exponential access distribution, meaning that if a graph is drawn with pages ordered with respect to the number of times they are accessed on the x-axis, and the number of accesses on the y-axis, that the distribution will look something like this:
By measuring the number of page reads and writes that occur during an application's execution, the curve representing the integral referred to above can be obtained. It in fact, will also have an exponential curve to it. Thus, using the following graph of number of page faults given a certain memory size, one can determine the number of page faults on a machine of 8MB by looking at the value of the curve at that point.
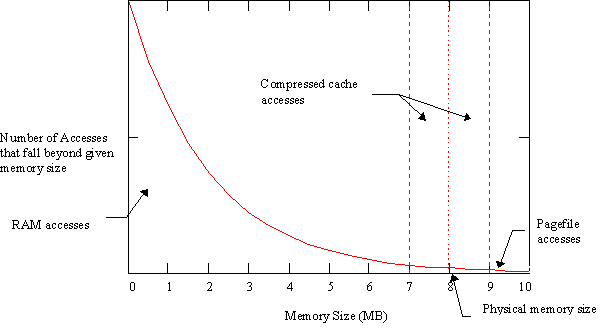
A compressed paging cache has several effects on the system. The first is that the system's usable memory size will decrease (line moves to the left) an amount equal to the size of the compression buffer. For example, if 1MB was taken for the compressed pagefile cache, Windows would only have 7MB to use for application memory, and the application would therefore generate page faults as if it were running on a 7MB machine. This is the first factor in determining cache effectiveness: causing more page faults.
The second effect of the pagefile cache is to create an intermediate range in the graph that extends on the x-axis from the place where the cache starts to the memory size and then beyond to a place determined by the compression ratio achieved. For example, if the cache was 1MB in size and a compression ratio of 2:1 is obtained, the cache effect area would extend from 7MB to 9MB (8MB memory size -1MB cache size + 1MB cache size * compression ratio of 2). This is shown in the graph below:
Because all page faults pass through the cache before making it to disk, any accesses to the right of the line at 7MB are accesses subjected to compression (and possibly decompression). This is the second factor in determining cache effectiveness: overhead of compression.Access that are to the right of the physical memory size line and to the left of the right cache line (at 9MB above) represent accesses that without the cache in place would have been disk accesses. With the cache in place, these accesses actually fall in the cache. This is the third factor in determining cache effectiveness: the number of disk accesses saved.
It should now be clear that for a cache to be effective, it basically has to satisfy the following releationship:
Overhead of compression for all accesses to the right of the buffer start (7MB in the example) must be less than the amount of time saved in avoiding disk I/O.
An additional factor that impacts a real implementation of pagefile caching under Windows 95 that is not taken into account in the above model is disk cache misses caused because the disk cache sizing policy is not set up to understand the effects of a pagefile cache. Another factor is additional disk accesses caused because the compression management strategy will most likely occasionally break page file writes, that come in blocks of 8 pages, into multiple writes in order to fit compressed pages into spots in the page file.
In order to get an idea of how well pagefile cacheing would work for real Windows applications, we measured the pagefile read and write rates of the Ziff-Davis Winstone benchmark. This gives us the access curves described above. The next thing we did is implement a pagefile cache compressor so that we could measure compression/decompression versus disk access overheads as well as compression ratios on the actual Winstone paging data.
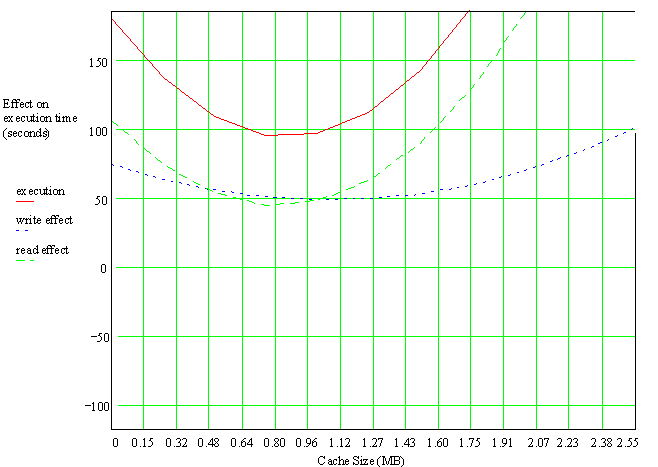
We then derived a mathematical expression for the model described above and plugged in numbers obtained from the measurements. The result we obtained was that although it appears possible in theory to obtain a benifit from a compressed pagefile cache, that for realistic parameters it is extremely difficult. The empirical evidence that backs this claim up are the performance of RAM Doubler, MagnaRAM 2, and our own implementation, all of which ended up lowering the Winstone score by significant amounts when a 1MB cache was used on an 8MB machine (incidentally, our implementation did the best by a wide margin, but still slowed the machine down).
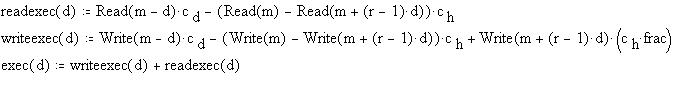
Here are the parameters used in the model:
performance effect = overhead of compression - time saved by avoided disk accesses
Positive results indicate a performance degredation (time added to a application's execution) and negative results are a performance improvement (time subtracted from an application's execution). The write execution equation has the additional term of overhead caused by increased pagefile writes (if any). The sum of the two sub-expressions (exec) is the overall effect of a compressed pagefile cache. The Read() and Write() functions used in the sub-expressions return the number of memory accesses that fall beyond the memory boundary passed as a parameter. For example, Read(8) returns the page faults, as determined through modeling or actual measurements, that occur when the application is run on an 8MB machine.
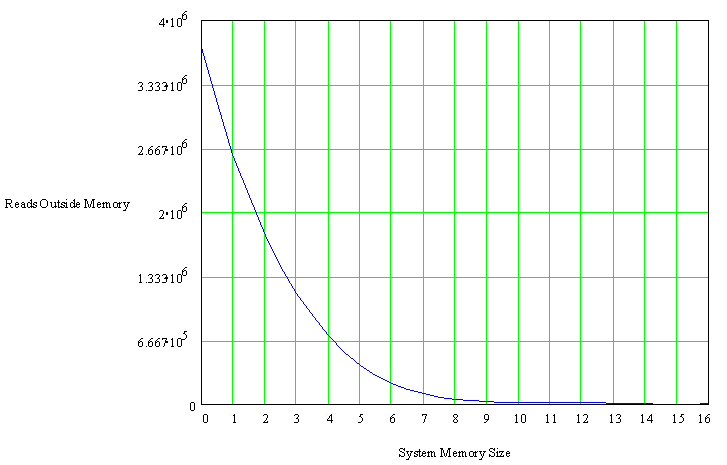
The following table shows the number of pagefile reads that occur for Winstone running with varying amounts of available memory (6MB, 7MB, etc.). Following the raw data is a graph of the data.
| Memory (MB) | Pagefile Reads |
| 6 | 229089 |
| 7 | 97257 |
| 8 | 55594 |
| 9 | 37678 |
| 10 | 26633 |
| 11 | 19379 |
| 12 | 14815 |
| 13 | 11193 |
| 14 | 8297 |
| 15 | 7065 |
| 16 | 5044 |
| Memory (MB) | Pagefile Write |
| 6 | 84533 |
| 7 | 51069 |
| 8 | 37106 |
| 9 | 30592 |
| 10 | 24964 |
| 11 | 20732 |
| 12 | 17599 |
| 13 | 14533 |
| 14 | 11700 |
| 15 | 10454 |
| 16 | 8479 |
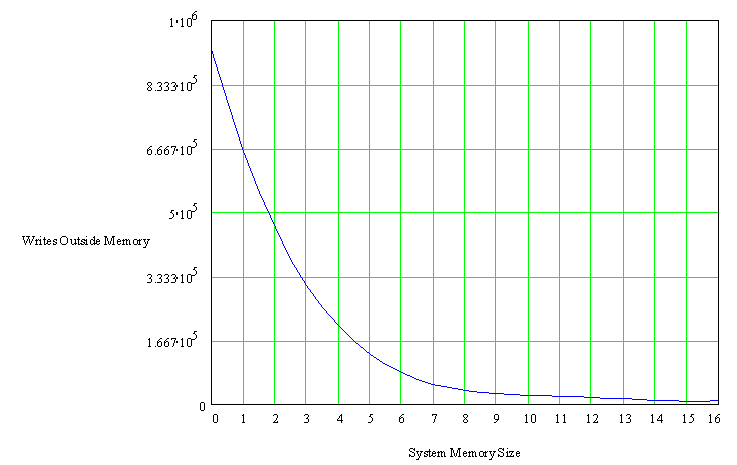
Below is the interpolated curve for the pagefile write data.
![[O'Reilly Home]](http://www.ora.com/graphics/ora-nav.gif) Our homepage,
with product information, feature articles, and more.
Our homepage,
with product information, feature articles, and more.
![[WebSite Home Page]](http://website.ora.com/images/homeicon.gif) WebSite Central,
home of O'Reilly's hot, new, Windows Web server.
WebSite Central,
home of O'Reilly's hot, new, Windows Web server.
![[O'Reilly Windows Center]](http://www.ora.com/win/graphics/win-nav.gif) The O'Reilly Windows Center
has Win 95 programming information, articles, and links.
FTP site, with newer versions.
The O'Reilly Windows Center
has Win 95 programming information, articles, and links.
FTP site, with newer versions.